Google Analytics 4 (GA4) is a robust and powerful analytics tool that provides indispensable information about your website and visitors.
You may already be using GA4 to track your website’s visitors, but if your analytics reports are not giving you information that helps to direct your marketing and grow your business, you may be missing an opportunity.
Even with GA4 up and running, it’s not easy to see the valuable insights that really matter to you. Google Analytics 4 has the power to collect a lot of great data, but it can’t highlight what is important for your business.
In this article, I will point you to some GA4 reports that are good places to start to look for actionable data.
(Also check out this new article on using GA4 to analyse your mobile traffic).
How are people reaching your website?
People can arrive at your website from a search engine or via links in emails, social media, Google ads or other websites. It is important to understand traffic sources (e.g. whether they are organic traffic) and their trends, since they are influenced by different marketing activities.
In GA4, it’s called Traffic acquisition and this report can be found under Acquisition > Traffic acquisition.
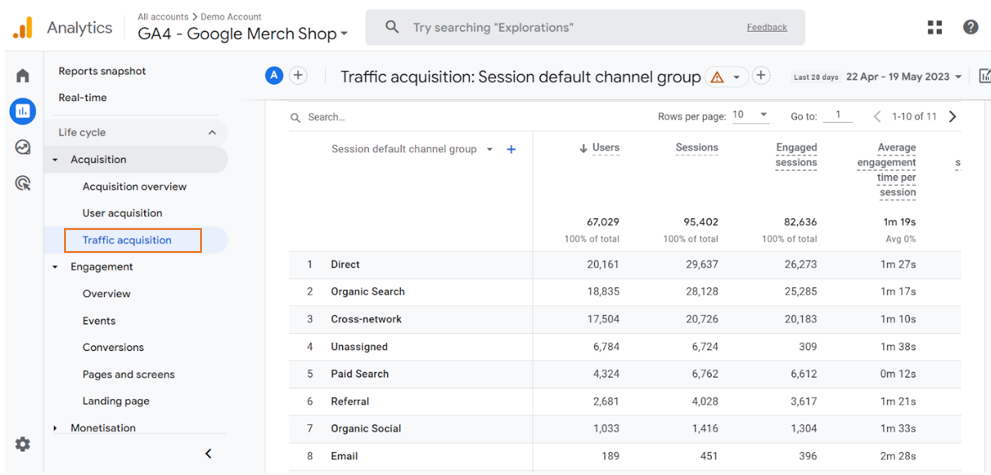
This report shows how people are reaching your website, broken down into broad channels. Initially, I would focus on these key metrics – Sessions, Engaged sessions, Average engagement time per session and Engagement rate. You will get an idea of the relative contribution of each channel, and whether the channels bring people who stay to look around your site after arriving. Note that all Google Analytics 4 reports are for a period that you can specify in the top right of the interface.
A session is counted for each visit to your website or app. Engaged session is the number of sessions that lasted longer than 10 seconds, or had a conversion event, or had 2 or more screen or page views. Engagement rate is the percentage of engaged sessions (Engaged sessions divided by Sessions), so generally speaking, the higher engagement rate, the better.
Your website may not have traffic from all of the possible channels. Visitors coming from Social, Paid Search and Email will depend on your marketing program. If you are linking to your website from email campaigns but not seeing the data in the Traffic acquisition report, it is likely that you haven’t tagged the email links for analytics reporting.
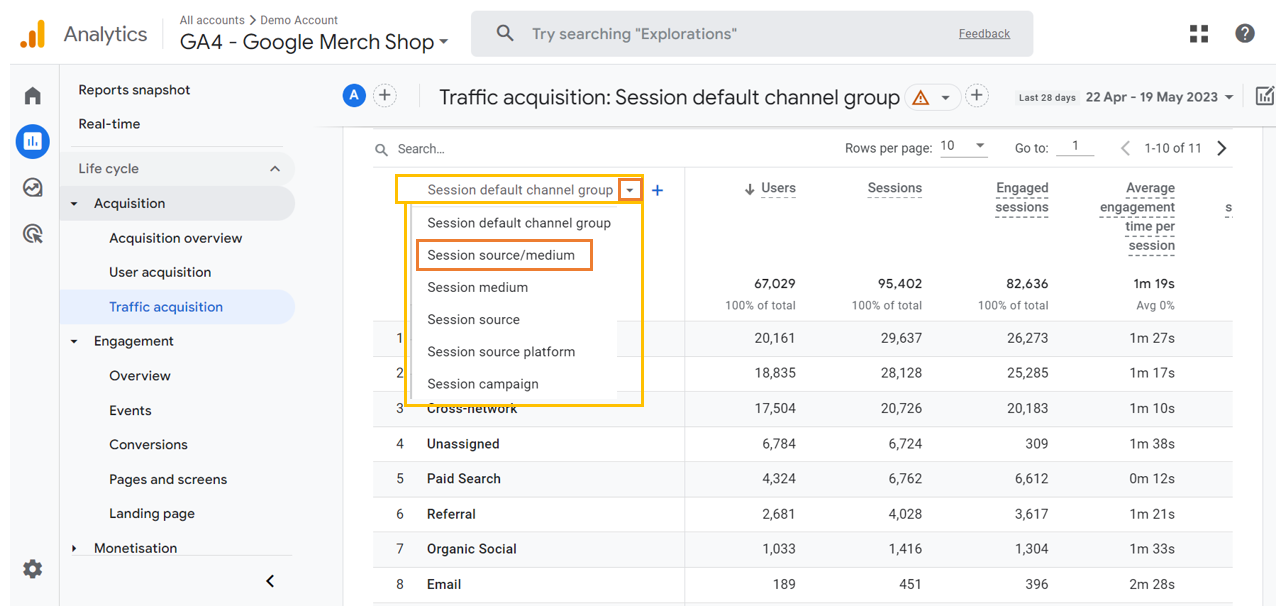
If you would like to see a breakdown that is more granular than Traffic acquisition, try viewing this same report by selecting Session source/medium from the column header drop-down.
What are people looking for when they find your website through Google?
Search engines are how people find you online, and Google is the most widely used. You will want to make sure that you are showing up for the search queries that you would expect people would use to look for your business. The reports that uncover this information are not in the GA4 menu by default. First we will look at what these reports tell you, and then we will see how to configure them.
Queries report
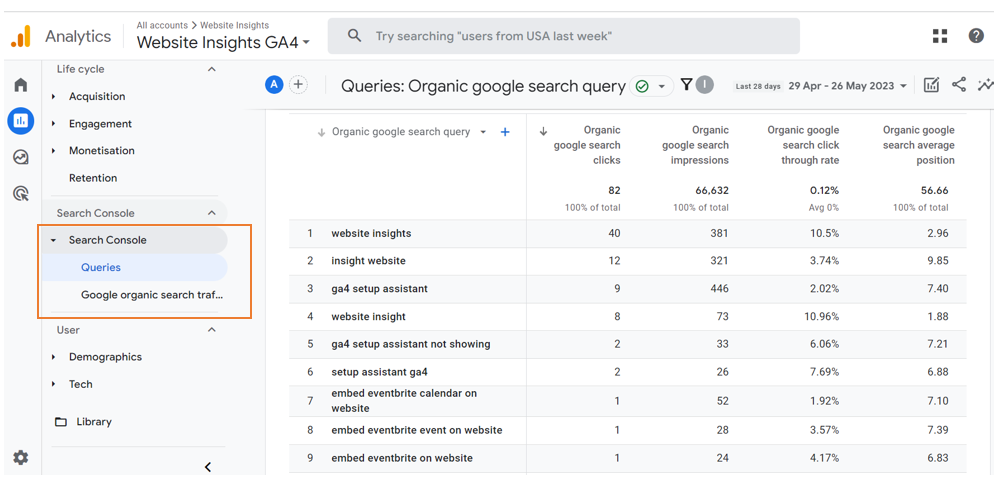
The Queries report lists the Google Search queries that generated impressions of your website URLs in Google organic search results.
Understanding the correlation between how users search and the relevancy of your pages to those queries provides insight into how to optimise your content.
The number of impressions that each page generates and the average position of impressions let you understand how well the search engine correlates your content to user queries. You can further understand user segments and user acquisition via Exploration reports as needed.
Clicks and click-through rate let you understand how well users correlate the search results with their intentions.
Google organic search traffic report
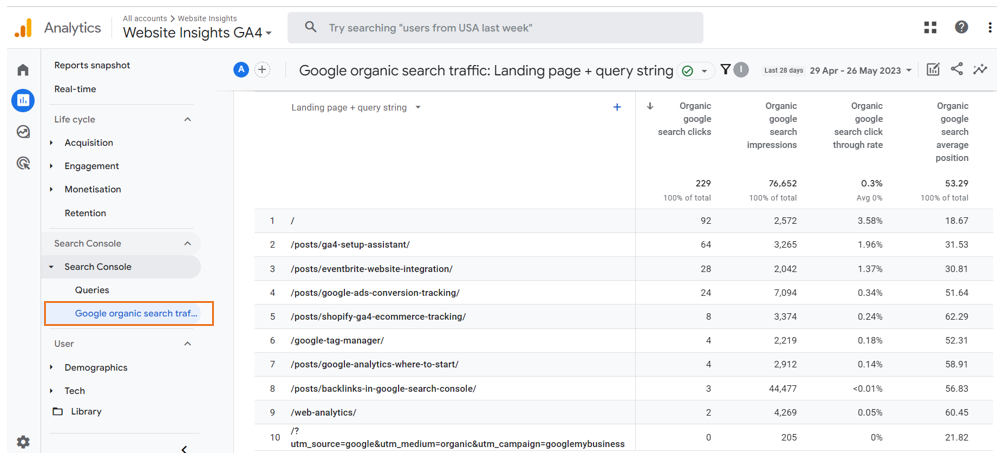
The Google organic search traffic report is similar, but with landing pages as the dimension.
To uncover nuggets from these reports, ask yourself:
- What search queries would you expect to see here but are missing?
- Are there pages that you would expect to be found by search, but they are not?
- Do some of your pages or some search queries have very low click-through rates in comparison to others?
- Are you showing up often for search queries that don’t reflect what you offer?
These reports can highlight where you need to work on improving the match between the topic/intent of the page, the actual content on the page, and the page title and meta description that appear in Google search results. A good match across these 3 things make it easier for Google’s algorithm to show your page in the search results in response to a searcher who is looking for a business like yours.
A tip: if you want to see how each of your web pages shows in Google’s search results page, type site:example.com/ into Google search, where example.com/ is your website. What you are seeing are the page titles and meta descriptions. Titles and meta descriptions have 2 roles – they tell the search engine what your page is about (along with the content on the page itself) and they entice the searcher to click on your page. Make sure you use meta descriptions to improve searchability. If you don’t fill this field in your content editing tool, Google will select some text to display under the search title.
How to set up Search Console reports
I mentioned at the start of this section that some set-up may be required. If you don’t see anything under these standard reports, it will be because Google Search Console is not linked to your Google Analytics 4 property. In this case, follow below part One and Two to set up the link and reports.
Part One: link GA4 to Google Search console
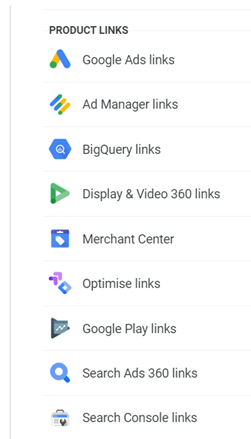
You can make the association in the Google Analytics 4 Property settings if your Google login is already the owner of the Google Search Console account. The steps are shown in the following screenshots.
Step 1: Open admin settings in Google Analytics 4, in the admin panel, scroll down to Product Links. Here you click on Search Console Links.
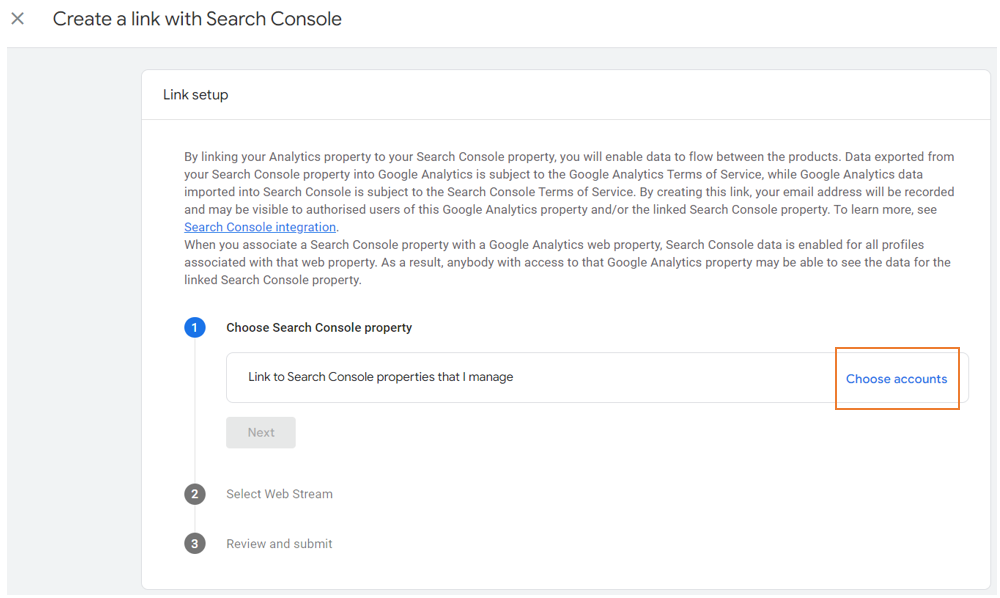
Step 2: Click on the blue button Link. This will open a configuration screen.

Step 3: Click on the Choose accounts button. This will open a list of accounts you can add to Google Analytics 4 accounts.
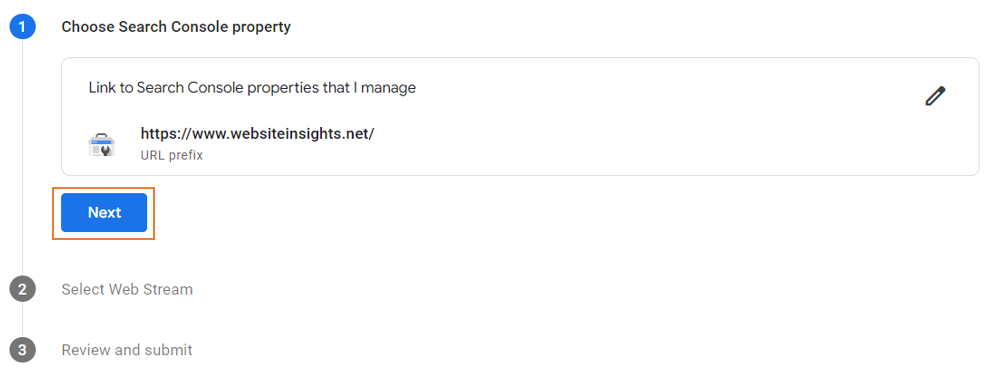
Step 4: Make sure you pick the right account (if you have more than one), and then click on the blue Confirm button to the right top corner.

Step 5: Click on the blue Next button.
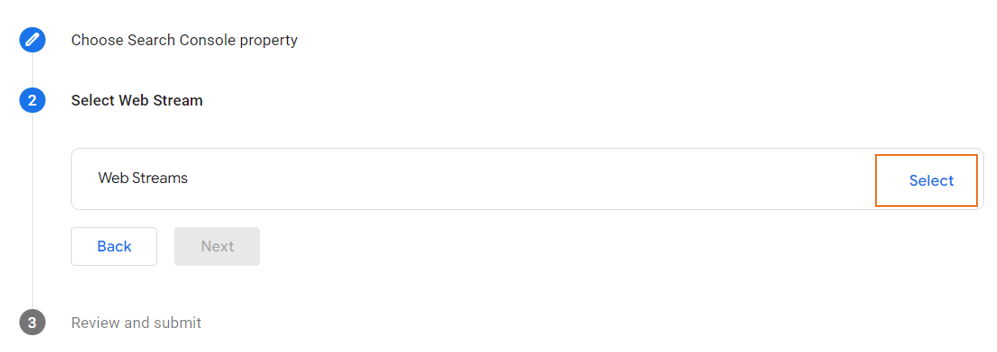
Step 6: Click on the Select button and pick the correct Web Stream.
Step 7: Review the summary and Submit if everything is right.
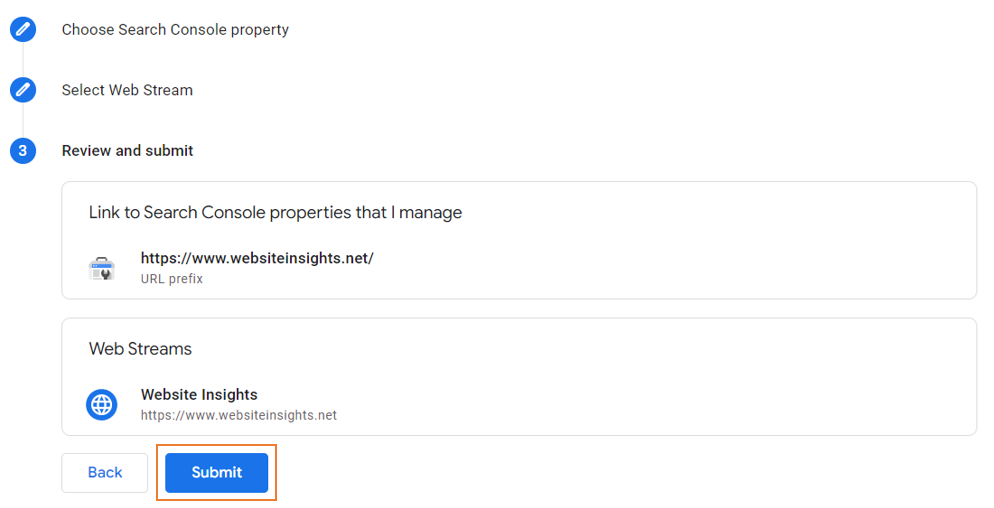
Upon submission, the next page confirms LINK CREATED.

Step 8: Click on the X button to the top left in the LINK CREATED page, you will now see a summary of the link created!

Part 2: add the reports to the menu using the Library
Now the link is created, let’s add the reports to the menu.
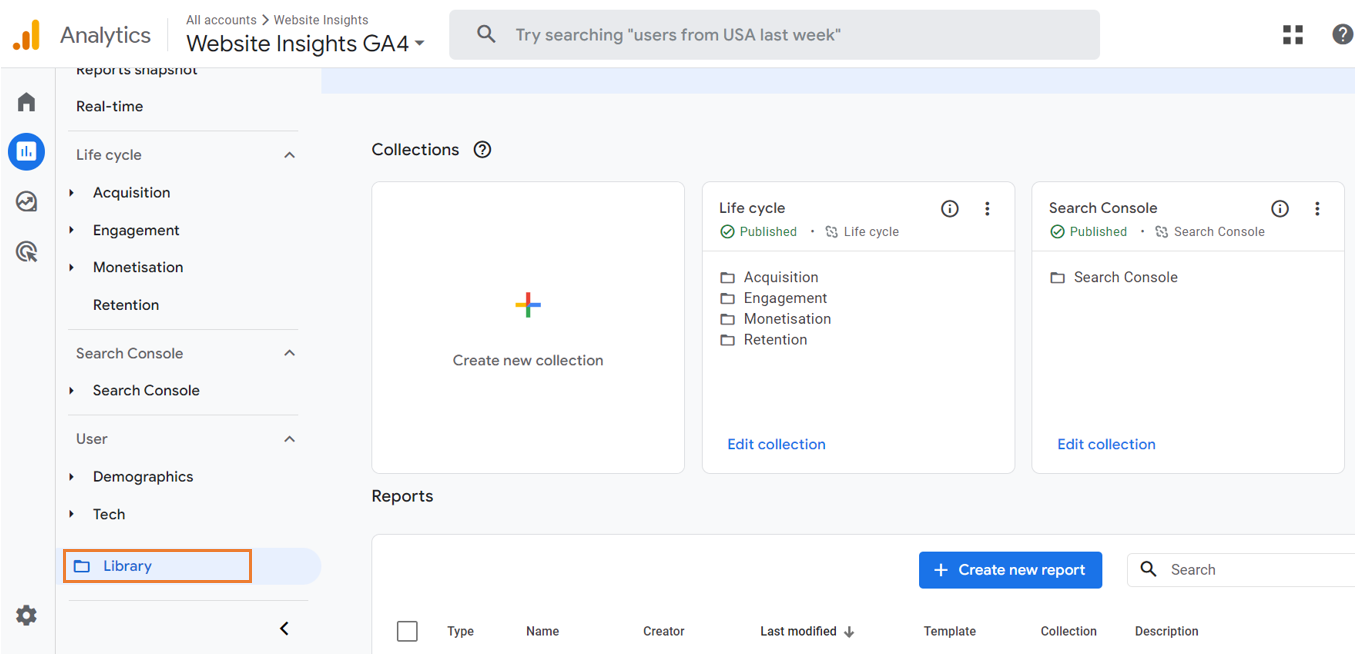
Step 1: Open Reports in Google Analytics 4 and scroll down to the bottom of the page, then click on Library in the menu on the left.
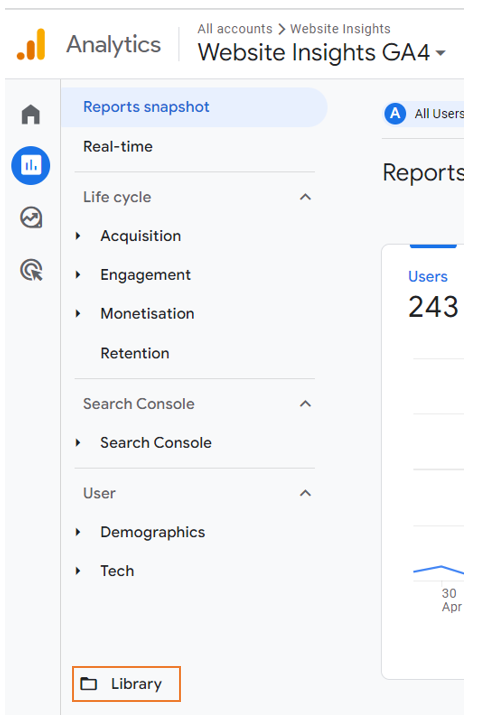
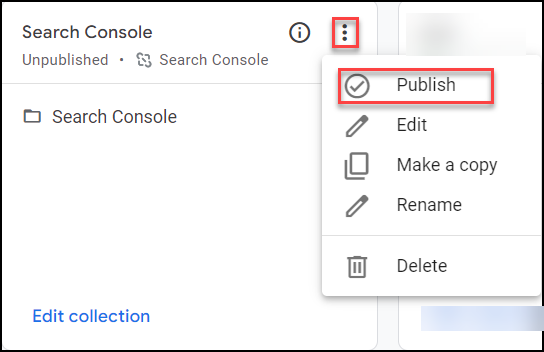
Step 2: In the Library, find the Search Console card in Collections.

Step 3: click on the 3 dots and choose ‘Publish’.
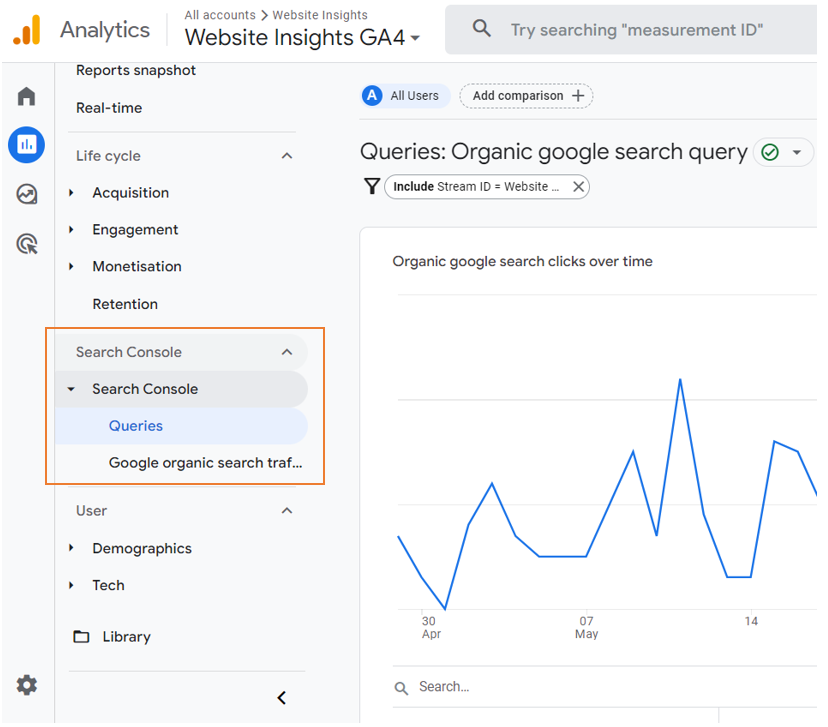
Where can you find Search Console reports in Google Analytics 4?
Google Search Console is a powerful tool to help marketers and webmasters gain invaluable search metrics and data. If you have followed the above steps, you can find your search console data under Reports. Click on a report to see more details, or customise it.
Where are your users coming from?
Total website traffic is interesting, but if you have a local business, you want to know that you are attracting website traffic from the local area. The location report, found under User > Demographics, provides an Overview and then Demographic details.
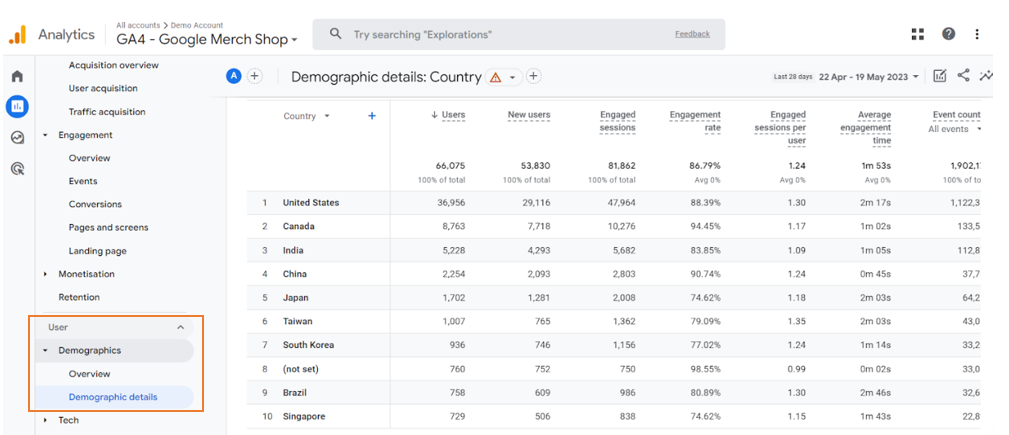
At the top of the report, you have the option to display results by other dimensions such as Region, Town/City, Language, Age, Gender or Interests.
You can also add a secondary dimension by clicking on the + sign next to say Country, this lets you break down the results further.
Are your marketing activities leading to valuable actions on your website?
You probably have forms on your website where people can contact you or opt in to your mailing list. In GA4, these valuable actions can be flagged as ‘Conversions’, and reports will help you understand the pathways that lead to them.
A conversion is a user action or user behaviour that you count because you consider it important. It could be a purchase, game level completion, form submission, or even website / app scroll activity.
If your GA4 implementation was planned with your business goals in mind, conversions will have been enabled and configured, and you will see data in the Conversions columns in many of the reports. If you can’t see this, it is worth getting some help from your analytics expert (check out my ‘done for you’ and ‘done with you’ Google Analytics services), since conversions give insight into the characteristics and behaviours of your ‘converters’, so you can keep fine-tuning your marketing.
Specifically, the Conversions report can be found under Engagement > Conversions, where the default report has the dimension of Event name. You can also add a secondary dimension by clicking on the + sign next to the Event name, to further drill down to the details.
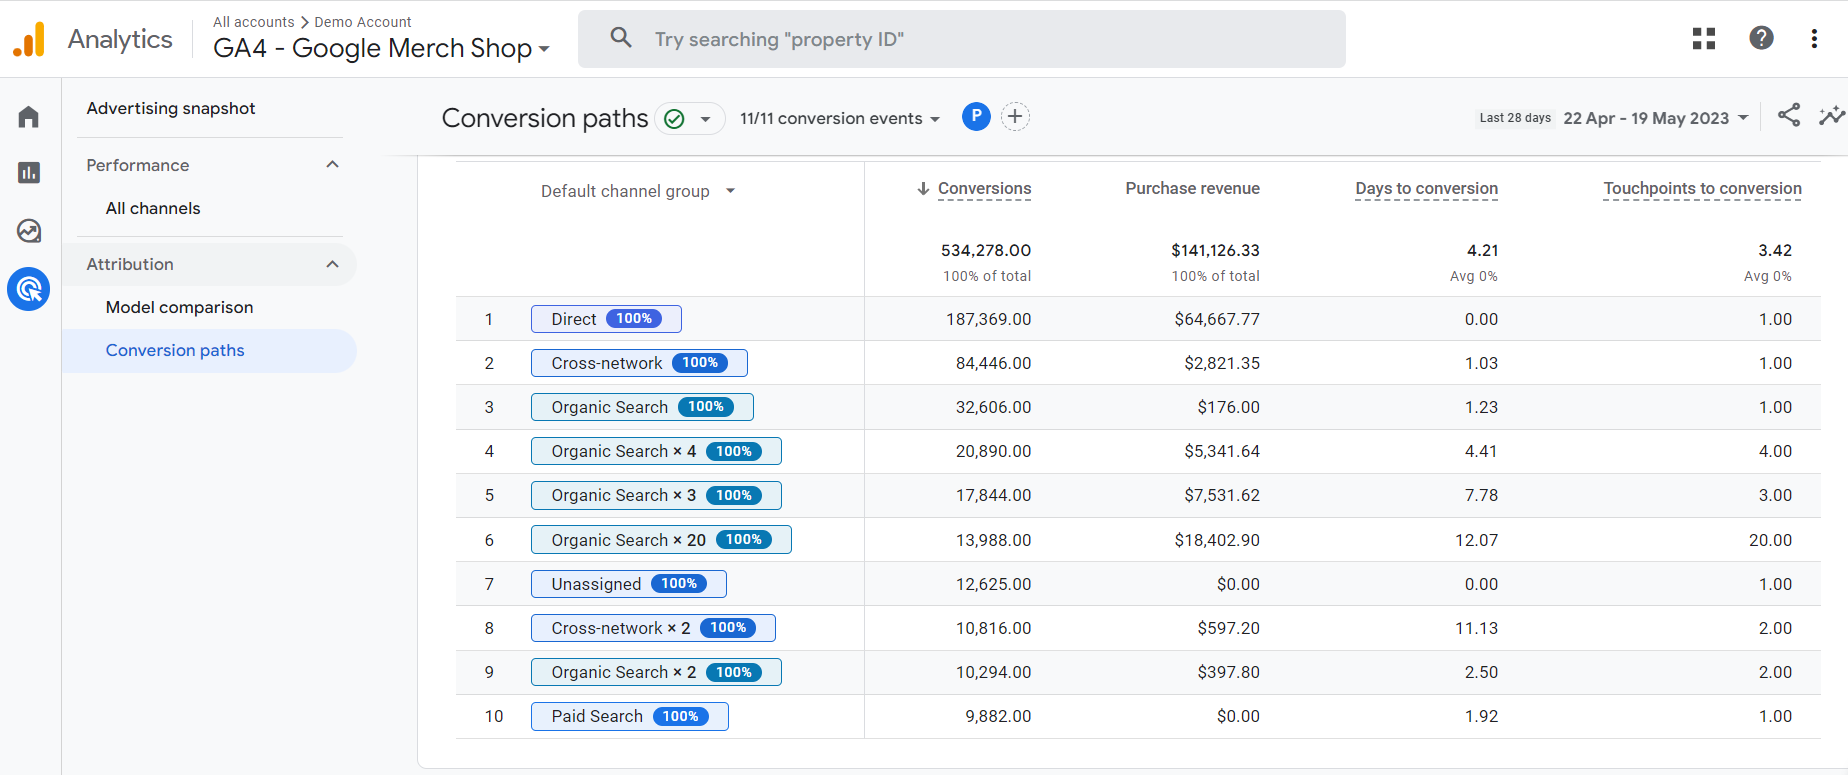
One report that I recommend you look at is the Conversion paths report, found under Advertising > Attribution > Conversion paths. Note that the Advertising section is at the same level of Reports but not within Reports.
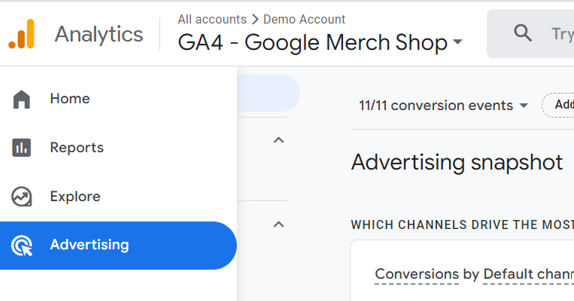
In Advertising, to start you can find some useful Advertising snapshots. The Advertising snapshot helps you better understand customer journeys and conversion performance. I like its visual simplicity and impact, showing how each of the channels contributes to conversions and conversion value. In the Conversion paths report you can change the summary view by changing Default channel group to Source, Medium or Campaign.
Save your favourite reports for easy reference
If you would like a variation of a report, e.g. with a filter applied, you can use the Edit button, at the top right of the report, to customise and save it with another name. When you do this, it will be available under the Reports > Library. If you don’t see Library, you don’t have permission. In the Library, you can ‘Edit collections’ to add your new report to the menu.
How can we help you with Google Analytics 4?
In conclusion, GA4 provides a wealth of data, but it is not always easy to know what to look for. When people are starting out with GA4, I always recommend that they start by focusing on a few predefined reports that reflect what is important to them.
The next step you could take in personalising custom reports is to use a reporting tool on top of GA4. For my clients, I generally use Looker Studio, a tool that lets me generate interactive and clear reports for the data that matters to the business.
Website Insights offers web analytics ‘done with you’. I can help you with measuring the right things on your website, interpreting the data and using it to do better with your online marketing efforts.

