A Looker Studio GA4 dashboard is an easy-to-digest view of key analytics metrics
Google Analytics can tell you a lot about what is happening on your website, but you don’t always need all that detail. Sometimes you want just a few key indicators to tell you that things are on track. This is where a dashboard can be really useful, as it summarises several metrics on one or two pages.
You can create your own version by using this Looker Studio GA4 template and replacing the data sources with your own.

Get access to the dashboard template
Pre-requisites for using the dashboard template:
- You are logged on with a Google-linked email address that has access to your GA4 property.
- Click the link to get the dashboard template
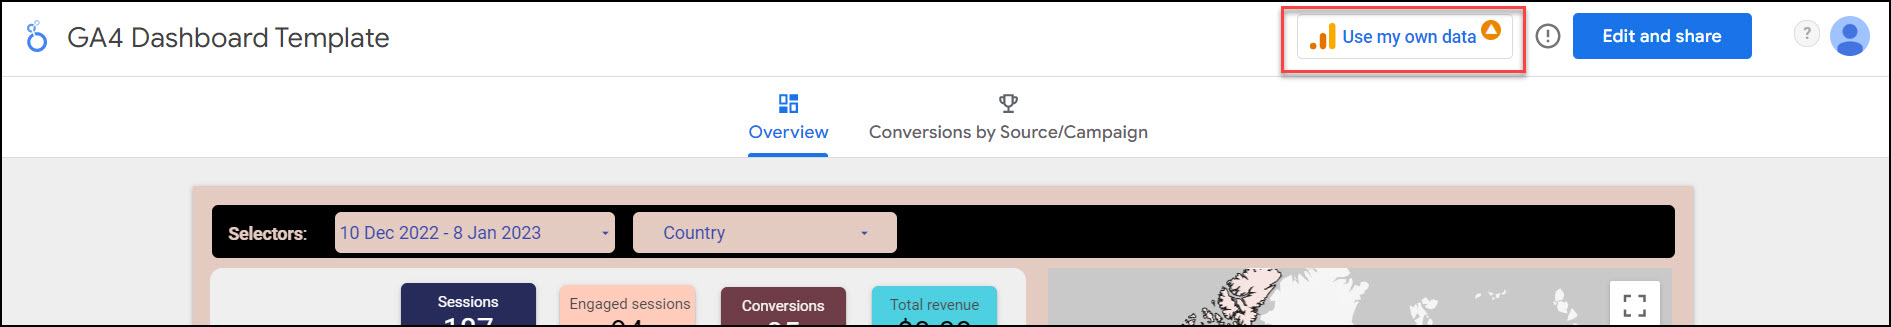
Click on Use my own data
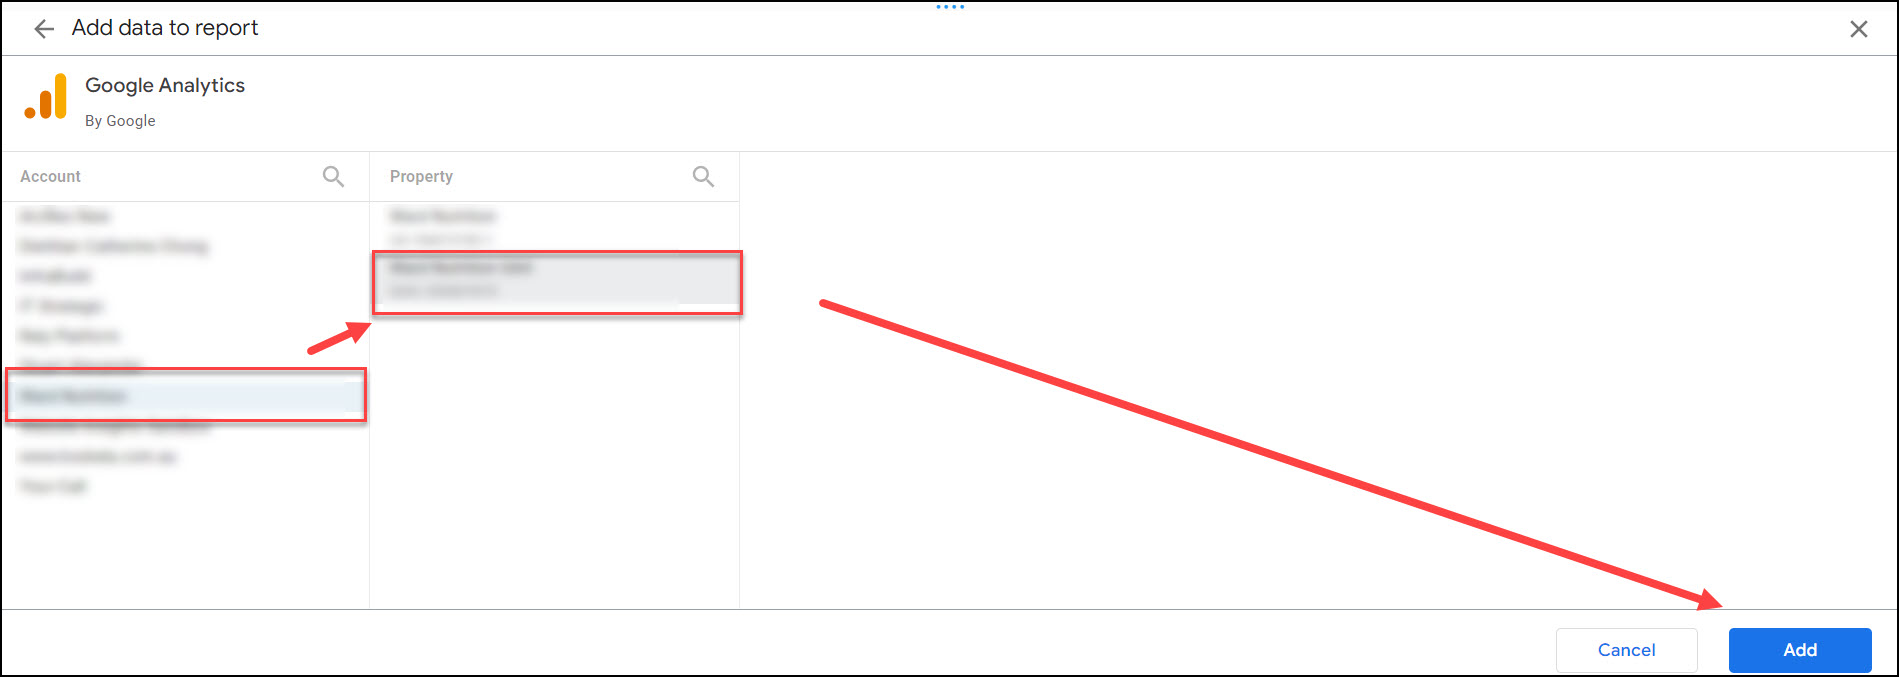
You will then be able to choose your data source. Choose an Account, choose a Property (it must be a GA4 property) and then at the next prompt, click Add then Add to Report.
The report template will populate with your data and a green tick will be displayed beside ‘Use my own data’.
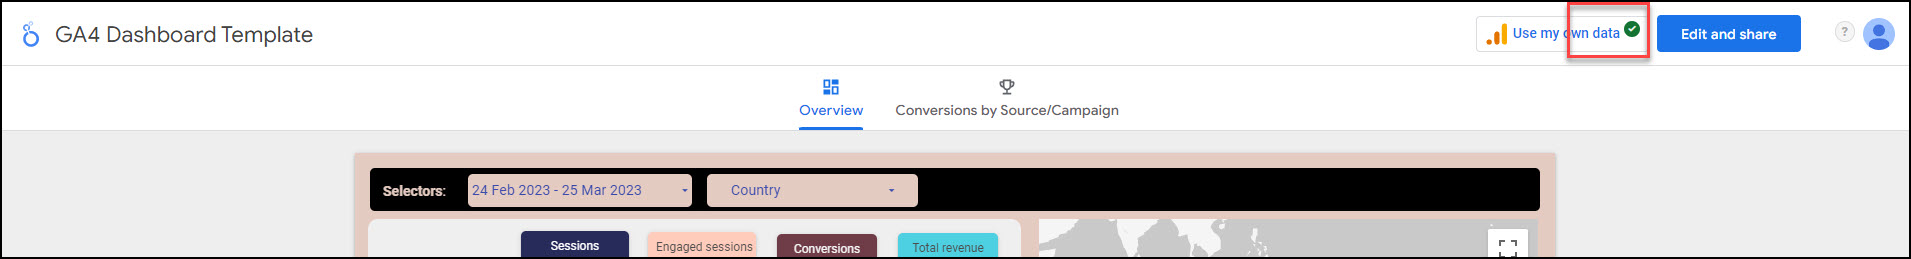
However, at this point you won’t have your own copy of the report. Click Edit and share

Then click Add to Report. This creates a copy of the report (owned by you), with your data.
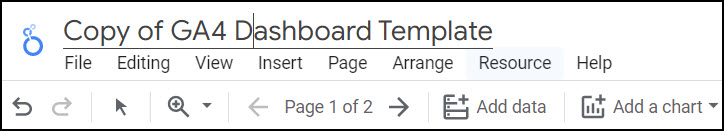
The report title will now be ‘Copy of GA4 Dashboard Template’. Click on the title to edit it – you can change it to something that is meaningful for you and your audience.
Click View to move from Edit mode to View mode.
Sometimes I find I get an error at the last step – a popup with ‘Get report failed’ is followed by another popup with the option to Add to Report again. I find that clicking on Add to Report, then shutting Looker Studio and re-opening it solves the problem. I can see the report ‘Copy of GA4 Dashboard Template’ and I can open it and see my data.
Once you have created your own version of the report, you will find it whenever you open Looker Studio (https://lookerstudio.google.com).
You will be able to edit the report – you could add a new page and some additional charts.
You will be able to share the report with others, either by sharing with specific email addresses or making the report available to anyone with the link.
Metrics that the dashboard will show you:
Sessions – The number of visits to your website over the selected period (with a comparison to the previous period). A visit could include multiple pageviews.
Engaged Sessions – these are sessions where the user either stayed for 10 seconds or more, visited 2 or more pages, or completed a conversion action.
Conversions – the actions that you have chosen to track as conversions because they have business value. If you have an ecommerce website, purchases will be conversions. You may also count things like newsletter sign-ups as conversions. Your conversions will need to be explicitly tracked at the time you implement GA4. Measuring website conversions is one of the main reasons to use Google Analytics.
Total revenue – this column applies for ecommerce websites.
Views – The total number of pages viewed on your website over the selected period.
Website Traffic Sources
Channels – A breakdown of your website sessions according to how the visit arrived at your website. Common channels include Organic search, Social, Email, Referral and Direct.
Countries – A breakdown of your website sessions by country where the visitor is located.
Campaigns – GA4 will track campaigns if you are running Google Ads, or if you are running other types of advertising and have used utm parameters on links to your website. In the dashboard you can see which of these advertising campaigns are driving conversions. Similarly, email campaigns will appear in this report if you have added utm parameters to links that lead back to your website.